
Page 296 - 360.revista de Alta Velocidad - Nº 5
P. 296
Grande, Zacarías. Torralbo, Julia. Lobera, José Manuel. Sánchez-Cambronero, Santos. Castillo, Enrique.
Similarly to the previous case, the costs per km in single- and double-track and mean operating
speed of each segment must be used as data for the ADST definition. For this case, 5 main
alternatives are defined, which differ from each other in the maximum relative travel time of
high speed services, varying from 1.20 to 1.00 in 0.5 intervals.
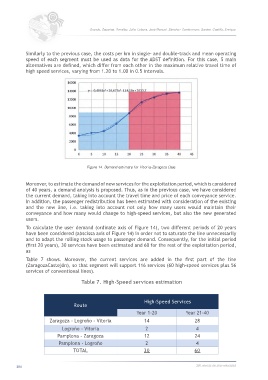
Figure 14. Demand estimate for Vitoria-Zaragoza Case.
Moreover, to estimate the demand of new services for the exploitation period, which is considered
of 40 years, a demand analysis is proposed. Thus, as in the previous case, we have considered
the current demand, taking into account the travel time and price of each conveyance service.
In addition, the passenger redistribution has been estimated with consideration of the existing
and the new line, i.e. taking into account not only how many users would maintain their
conveyance and how many would change to high-speed services, but also the new generated
users.
To calculate the user demand (ordinate axis of Figure 14), two different periods of 20 years
have been considered (abscissa axis of Figure 14) in order not to saturate the line unnecessarily
and to adapt the rolling stock usage to passenger demand. Consequently, for the initial period
(first 20 years), 30 services have been estimated and 60 for the rest of the exploitation period,
as
Table 7 shows. Moreover, the current services are added in the first part of the line
(ZaragozaCastejón), so that segment will support 116 services (60 high-speed services plus 56
services of conventional lines).
Table 7. High-Speed services estimation
High-Speed Services
Route
Year 1-20 Year 21-40
Zaragoza - Logroño - Vitoria 14 28
Logroño - Vitoria 2 4
Pamplona - Zaragoza 12 24
Pamplona - Logroño 2 4
TOTAL 30 60
294 360.revista de alta velocidad