
Page 267 - 360.revista de Alta Velocidad - Nº 6
P. 267
Study of Transit-Oriented Development model implementation on the surroundings of Alicante
high-speed rail station
Possible points
Category Mini- Maxi- Points
mum mum
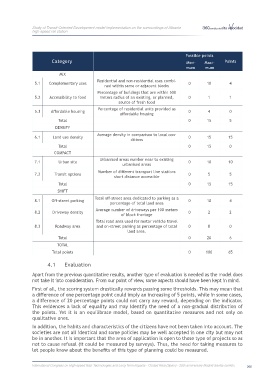
MIX
Residential and non-residential uses combi-
5.1 Complementary uses 0 10 4
ned within same or adjacent blocks
Percentage of buildings that are within 500
5.2 Accessibility to food meters radius of an existing, or planned, 0 1 1
source of fresh food
Percentage of residential units provided as
5.3 Affordable housing 0 4 0
affordable housing
Total 0 15 5
DENSIFY
Average density in comparison to local con-
6.1 Land use density 0 15 15
ditions
Total 0 15 0
COMPACT
Urbanised areas number near to existing
7.1 Urban site 0 10 10
urbanised areas
Number of different transport line stations
7.2 Transit options 0 5 5
short distance accessible
Total 0 15 15
SHIFT
Total off-street area dedicated to parking as a
8.1 Off-street parking 0 10 4
percentage of total land area
Average number of driveways per 100 meters
8.2 Driveway density 0 2 2
of block frontage
Total road area used for motor vehicle travel
8.3 Roadway area and on-street parking as percentage of total 0 8 0
land area.
Total 0 20 6
TOTAL
Total points 0 100 65
4.1 Evaluation
Apart from the previous quantitative results, another type of evaluation is needed as the model does
not take it into consideration. From our point of view, some aspects should have been kept in mind.
First of all, the scoring system drastically rewards passing some thresholds. This may mean that
a difference of one percentage point could imply an increasing of 5 points, while in some cases,
a difference of 20 percentage points could not carry any reward, depending on the indicator.
This evidences a lack of equality and may identify the need of a non-gradual distribution of
the points. Yet it is an equilibrate model, based on quantitative measures and not only on
qualitative ones.
In addition, the habits and characteristics of the citizens have not been taken into account. The
societies are not all identical and some policies may be well accepted in one city but may not
be in another. It is important that the area of application is open to those type of projects so as
not to cause refusal (it could be measured by surveys). Thus, the need for taking measures to
let people know about the benefits of this type of planning could be measured.
International Congress on High-speed Rail: Technologies and Long Term Impacts - Ciudad Real (Spain) - 25th anniversary Madrid-Sevilla corridor 265