Page 266 - 360.revista de Alta Velocidad - Nº 6
P. 266

Bautista Rodríguez, David. Ortuño Padilla, Armando.Fernández Aracil, Patricia.
                                                                       Sánchez Galiano, Juan Carlos. Mompó Guerra, Antonio.


                 4.    Results


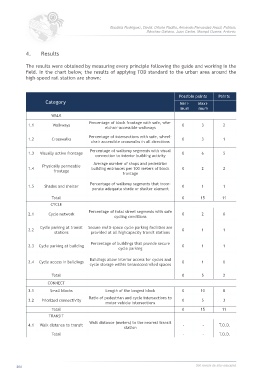
                 The results were obtained by measuring every principle following the guide and working in the
                 field. In the chart below, the results of applying TOD standard to the urban area around the
                 high-speed rail station are shown:


                                                                                     Possible points   Points

                         Category                                                    Mini-   Maxi-

                                                                                     mum     mum
                            WALK
                                             Percentage of block frontage with safe, whe-
                  1.1       Walkways                                                  0        3        2
                                                    elchair-accessible walkways
                                             Percentage of intersections with safe, wheel-
                  1.2       Crosswalks                                                0        3        1
                                              chair accessible crosswalks in all directions
                                             Percentage of walkway segments with visual
                  1.3   Visually active frontage                                      0        6        5
                                               connection to interior building activity
                                               Average number of shops and pedestrian
                        Physically permeable
                  1.4                         building entrances per 100 meters of block   0   2        2
                             frontage
                                                            frontage
                                             Percentage of walkway segments that incor-
                  1.5    Shades and shelter                                           0        1        1
                                              porate adequate shade or shelter element
                            Total                                                     0       15        11
                            CYCLE
                                             Percentage of total street segments with safe
                  2.1      Cycle network                                              0        2        0
                                                        cycling conditions

                       Cycle parking at transit   Secure multi-space cycle parking facilities are
                  2.2                                                                 0        1        1
                             stations        provided at all highcapacity transit stations
                                             Percentage of buildings that provide secure
                  2.3  Cycle parking at building                                      0        1        1
                                                          cycle parking

                                             Buildings allow interior access for cycles and
                  2.4  Cycle access in buildings                                      0        1        0
                                             cycle storage within tenantcontrolled spaces
                            Total                                                     0        5        2
                          CONNECT
                  3.1      Small blocks             Length of the longest block       0       10        8
                                             Ratio of pedestrian and cycle intersections to
                  3.2   Priorized connectivity                                        0        5        3
                                                    motor vehicle intersections
                            Total                                                     0       15        11
                           TRANSIT
                                             Walk distance (meters) to the nearest transit
                  4.1   Walk distance to transit                                      -        -      T.O.D.
                                                            station
                            Total                                                     -        -      T.O.D.


            264                                                                             360.revista de alta velocidad
   261   262   263   264   265   266   267   268   269   270   271