
Page 141 - 360.revista de Alta Velocidad - Nº 5
P. 141
Probabilistic Safety Analysis of High Speed and Conventional Railway Lines
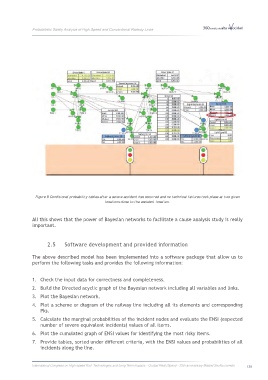
Figure 9 Conditional probability tables after a severe accident has occurred and no technical failures took place at two given
locations close to the accident location.
All this shows that the power of Bayesian networks to facilitate a cause analysis study is really
important.
2.5 Software development and provided information
The above described model has been implemented into a software package that allow us to
perform the following tasks and provides the following information:
1. Check the input data for correctness and completeness.
2. Build the Directed acyclic graph of the Bayesian network including all variables and links.
3. Plot the Bayesian network.
4. Plot a scheme or diagram of the railway line including all its elements and corresponding
Pks.
5. Calculate the marginal probabilities of the incident nodes and evaluate the ENSI (expected
number of severe equivalent incidents) values of all items.
6. Plot the cumulated graph of ENSI values for identifying the most risky items.
7. Provide tables, sorted under different criteria, with the ENSI values and probabilities of all
incidents along the line.
International Congress on High-speed Rail: Technologies and Long Term Impacts - Ciudad Real (Spain) - 25th anniversary Madrid-Sevilla corridor 139