
Page 144 - 360.revista de Alta Velocidad - Nº 5
P. 144
Grande, Zacarías. Blanco López, Marta. García Tamames, Alberto. Castillo, Enrique.
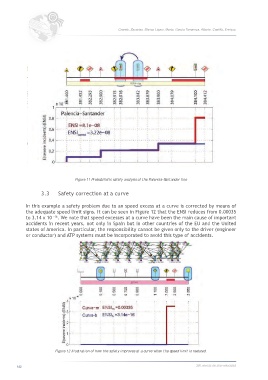
Figure 11 Probabilistic safety analysis of the Palencia-Santander line
3.3 Safety correction at a curve
In this example a safety problem due to an speed excess at a curve is corrected by means of
the adequate speed limit signs. It can be seen in Figure 12 that the ENSI reduces from 0.00035
-16
to 3.14 x 10 . We note that speed excesses at a curve have been the main cause of important
accidents in recent years, not only in Spain but in other countries of the EU and the United
states of America. In particular, the responsibility cannot be given only to the driver (engineer
or conductor) and ATP systems must be incorporated to avoid this type of accidents.
Figure 12 Illustration of how the safety improves at a curve when the speed limit is reduced.
142 360.revista de alta velocidad