
Page 143 - 360.revista de Alta Velocidad - Nº 5
P. 143
Probabilistic Safety Analysis of High Speed and Conventional Railway Lines
quantification of the safety level previously and after the corrections have been done. This
quantifications makes one of the meain differences of the proposed methods with respect to
existing ones.
3.1 Example of the line Zaragoza-Miranda
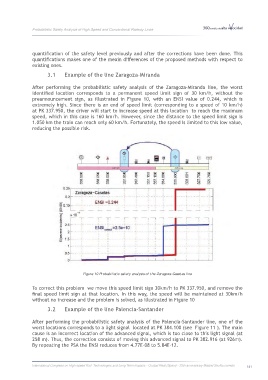
After performing the probabilistic safety analysis of the Zaragoza-Miranda line, the worst
identified location corresponds to a permanent speed limit sign of 30 km/h, without the
preannouncement sign, as illustrated in Figure 10, with an ENSI value of 0.244, which is
extremely high. Since there is an end of speed limit (corresponding to a speed of 10 km/h)
at PK 337.950, the driver will start to increase speed at this location to reach the maximum
speed, which in this case is 160 km/h. However, since the distance to the speed limit sign is
1.050 km the train can reach only 60 km/h. Fortunately, the speed is limited to this low value,
reducing the possible risk.
Figure 10 Probabilistic safety analysis of the Zaragoza-Casetas line
To correct this problem we move this speed limit sign 30km/h to PK 337.950, and remove the
final speed limit sign at that location. In this way, the speed will be maintained at 30km/h
without no increase and the problem is solved, as illustrated in Figure 10
3.2 Example of the line Palencia-Santander
After performing the probabilistic safety analysis of the Palencia-Santander line, one of the
worst locations corresponds to a light signal located at PK 384.100 (see Figure 11 ). The main
cause is an incorrect location of the advanced signal, which is too close to this light signal (at
258 m). Thus, the correction consists of moving this advanced signal to PK 382.916 (at 926m).
By repeating the PSA the ENSI reduces from 4.77E-08 to 5.84E-12.
International Congress on High-speed Rail: Technologies and Long Term Impacts - Ciudad Real (Spain) - 25th anniversary Madrid-Sevilla corridor 141