
Page 138 - 360.revista de Alta Velocidad - Nº 5
P. 138
Grande, Zacarías. Blanco López, Marta. García Tamames, Alberto. Castillo, Enrique.
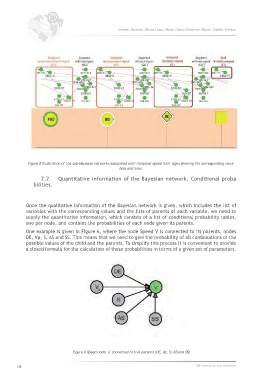
Figure 5 Illustration of the sub-Bayesian networks associated with temporal speed limit signs showing the corresponding varia-
bles and links.
2.2 Quantitative information of the Bayesian network. Conditional proba
bilities.
Once the qualitative information of the Bayesian network is given, which includes the list of
variables with the corresponding values and the lists of parents of each variable, we need to
supply the quantitative information, which consists of a list of conditional probability tables,
one per node, and contains the probabilities of each node given its parents.
One example is given in Figure 6, where the node Speed V is connected to its parents, nodes
DE, Vp, S, AS and SS. This means that we need to give the probability of all combinations of the
possible values of the child and the parents. To simplify this process it is convenient to provide
a closed formula for the calculation of these probabilities in terms of a given set of parameters.
Figure 6 Speed node, V, connected to five parents (DE, Vp, S, AS and SS)
136 360.revista de alta velocidad