
Page 22 - 360.revista de Alta Velocidad - Nº 6
P. 22
Folgueira, César. Jaro, Lorenzo.
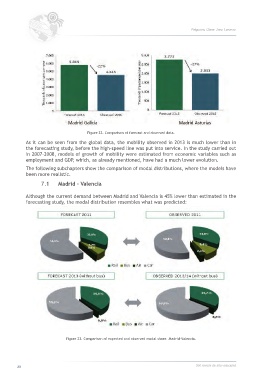
Figure 22. Comparison of forecast and observed data.
As it can be seen from the global data, the mobility observed in 2013 is much lower than in
the forecasting study, before the high-speed line was put into service. In the study carried out
in 2007-2008, models of growth of mobility were estimated from economic variables such as
employment and GDP, which, as already mentioned, have had a much lower evolution.
The following subchapters show the comparison of modal distributions, where the models have
been more realistic.
7.1 Madrid – Valencia
Although the current demand between Madrid and Valencia is 45% lower than estimated in the
forecasting study, the modal distribution resembles what was predicted:
Figure 23. Comparison of expected and observed modal share. Madrid-Valencia.
20 360.revista de alta velocidad