
Page 155 - 360.revista de Alta Velocidad - Nº 6
P. 155
Central versus Peripheral High-Speed Rail Stations: Opportunities For Companies to Relocate?
The cases of Reims Central Station and Champagne-Ardenne Station
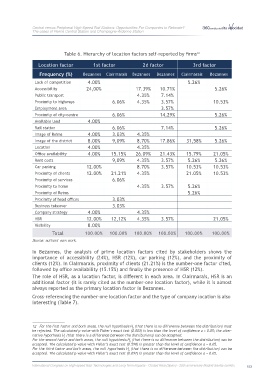
Table 6. Hierarchy of location factors self‐reported by firms 12
Location factor 1st factor 2d factor 3rd factor
Frequency (%) Bezannes Clairmarais Bezannes Bezannes Clairmarais Bezannes
Lack of competition 4.00% 5.26%
Accessibility 24,00% 17.39% 10.71% 5.26%
Public transport 4.35% 7.14%
Proximity to highways 6.06% 4.35% 3.57% 10.53%
Employment area 3.57%
Proximity of city‐centre 6.06% 14,29% 5.26%
Available land 4.00%
Rail station 6.06% 7.14% 5.26%
Image of Reims 4.00% 3.03% 4.35%
Image of the district 8.00% 9,09% 8.70% 17.86% 31,58% 5.26%
Location 4.00% 4.35%
Office availability 4.00% 15.15% 26.09% 21.43% 15.79% 21.05%
Rent costs 9,09% 4.35% 3.57% 5.26% 5.26%
Car parking 12.00% 8.70% 3.57% 10.53% 10.53%
Proximity of clients 12.00% 21.21% 4.35% 21.05% 10.53%
Proximity of services 6.06%
Proximity to home 4.35% 3.57% 5.26%
Proximity of Reims 5.26%
Proximity of head offices 3.03%
Business takeover 3.03%
Company strategy 4.00% 4.35%
HSR 12.00% 12,12% 4.35% 3.57% 21.05%
Visibility 8.00%
Total 100.00% 100.00% 100.00% 100.00% 100.00% 100.00%
Source: authors’ own work.
In Bezannes, the analysis of prime location factors cited by stakeholders shows the
importance of accessibility (24%), HSR (12%), car parking (12%), and the proximity of
clients (12%). In Clairmarais, proximity of clients (21.21%) is the number‐one factor cited,
followed by office availability (15.15%) and finally the presence of HSR (12%).
The role of HSR, as a location factor, is different in each area. In Clairmarais, HSR is an
additional factor (it is rarely cited as the number‐one location factor), while it is almost
always reported as the primary location factor in Bezannes.
Cross‐referencing the number‐one location factor and the type of company location is also
interesting (Table 7).
12 For the first factor and both areas, the null hypothesis H (that there is no difference between the distribution) must
0
be rejected. The calculated p‐value with Fisher’s exact test (0.003) is less than the level of confidence α = 0.05; the alter‐
native hypothesis H (that there is a difference between the distributions) can be accepted.
1
For the second factor and both areas, the null hypothesis H (that there is no difference between the distribution) can be
0
accepted. The calculated p‐value with Fisher’s exact test (0.598) is greater than the level of confidence α = 0.05.
For the third factor and both areas, the null hypothesis H (that there is no difference between the distribution) can be
0
accepted. The calculated p‐value with Fisher’s exact test (0.097) is greater than the level of confidence α = 0.05.
International Congress on High-speed Rail: Technologies and Long Term Impacts - Ciudad Real (Spain) - 25th anniversary Madrid-Sevilla corridor 153