Page 75 - 360.revista de Alta Velocidad - Nº 6
P. 75

Airline and railway disintegration in China: the case of Shanghai Hongqiao Integrated Transport Hub


                   door travel time) aircraft services are of course considerably faster, with only on two routes

                   (Jinan and Wenzhou) the difference is less than 3 h. Assuming a check-in time of two hours
                   for flights and only 30 min for rail in China, flights are still faster by a margin on all routes
                   (Table 4). Thus, travelling by HSR might be competitive to the flight in terms of travel time
                   only if the railway station is located in the city centre while the airport considerably far
                   from the centre. In addition to travel time, comfort factors should also be considered in the
                   comparison between air and rail and the advantage here is clearly with travelling by HSR,
                   which provides the conditions to use travel time for work, rest, etc.

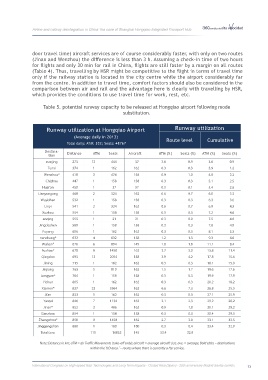
                        Table 5. potential runway capacity to be released at Hongqiao airport following mode
                                                            substitution.


                                                                                   Runway utilization
                          Runway utilization at Hongqiao Airport
                                      (Average daily in 2013)
                                   Total daily: ATM: 332; Seats: 48767         Route level       Cumulative
                         Destina-  Distance   ATM    Seats    Aircraft      ATM (%)  Seats (%)  ATM (%)  Seats (%)
                           tion
                          nanjing    273      12      444        37          3.6         0.9      3.6      0.9
                          Tunxi      374      1       162       162          0.3         0.3      3.9      1.2
                         Wenzhou*    418      3       474       158          0.9         1.0      4.8      2.2
                         Chizhou     447      1       158       158          0.3         0.3      5.1      2.5
                        Huai’an      450      1        37        37          0.3         0.1      5.4      2.6
                      Lianyungang    468      2       324       162          0.6         0.7      6.0      3.3
                       Wuyishan      532      1       158        158         0.3         0.3      6.3      3.6
                         Linyi       541      2       324        162         0.6         0.7      6.9      4.3
                        Xuzhou       554      1       158        158         0.3         0.3      7.2      4.6
                        anqing       555      1        21        21          0.3         0.0      7.5      4.6
                       Jingdezhen    589      1       158        158         0.3         0.3      7.8      4.9
                        Fuyang       606      1       162        162         0.3         0.3      8.1      5.3
                       nanchang*     632      4       632        158         1.2         1.3      9.3      6.6
                        Wuhan*       676      6       894        149         1.8         1.8     11.1      8.4
                        Fuzhou*      678      9       1458       162         2.7         3.0     13.8      11.4
                       Qingdao       693      13      2054       158         3.9         4.2     17.8      15.6
                        Jining       715      1       162        162         0.3         0.3     18.1      15.9
                        Jinjiang     763      5       810        162         1.5         1.7     19.6      17.6
                       Longyan*      784      1       158        158         0.3         0.3     19.9      17.9
                        Yichun       805      1       162        162         0.3         0.3     20.2      18.2
                        Xiamen*      827      22      3564       162         6.6         7.3     26.8      25.5
                         Ji’an       833      1       162        162         0.3         0.3     27.1      25.9
                        Yantai       846      7       1134       162         2.1         2.3     29.2      28.2
                        Jinan*       852      3       486        162         0.9         1.0     30.1      29.2
                       Ganzhou       854      1       158        158         0.3         0.3     30.4      29.5
                      Zhengzhou*     858      9       1458       162         2.7         3.0     33.1      32.5
                      Jinggangshan   860      1       180        180         0.3         0.4     33.4      32.9
                       Total/ave.            111       16052     145        33.4        32.9

                       Note: Distance in km; aTM = air Traffic Movements (take-off only); aircraft = average aircraft size. ave. = average, Bold cities – destinations
                                                          *
                                             within the YrD area.  – routes where there is currently a Hsr service.


                   International Congress on High-speed Rail: Technologies and Long Term Impacts - Ciudad Real (Spain) - 25th anniversary Madrid-Sevilla corridor  73
   70   71   72   73   74   75   76   77   78   79   80