Page 319 - 360.revista de Alta Velocidad - Nº 6
P. 319

Regional diffusion and adoption effects on HSR demand expansion


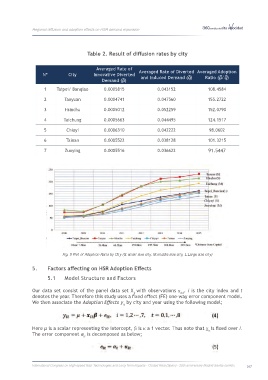
                                            Table 2. Result of diffusion rates by city


                                                Averaged Rate of   Averaged Rate of Diverted  Averaged Adoption
                                                                                                       − −
                        Nº         City        Innovative Diverted   and Induced Demand (q)     Ratio (p/q)
                                                                                         −
                                                           −
                                                  Demand (p)
                         1    Taipei/ Banqiao      0.0005815               0.043152              108.4584
                         2        Taoyuan          0.0004741               0.047560              155.2722

                         3        Hsinchu          0.0005012               0.052259              152.0790

                         4       Taichung          0.0005663               0.044495              124.1517

                         5         Chiayi          0.0006310               0.042222               98.0602

                         6        Tainan           0.0005522               0.038128              101.3215

                         7        Zuoying          0.0005516               0.036622               91.5447


                                 Fig. 5 Plot of Adoption Ratio by City (S: small sixe city, M:middle size city, L:Large size city)


                   5.     Factors affecting on HSR Adoption Effects

                          5.1     Model Structure and Factors

                   Our data set consist of the panel data set X  with observations x . i is the city index and t
                                                                k
                                                                                     itk
                   denotes the year. Therefore this study uses a fixed effect (FE) one-way error component model.
                   We then associate the Adoption Effects y  by city and year using the following model;
                                                            it


                   Here μ is a scalar representing the intercept, β is κ a 1 vector. Thus note that χ is fixed over i.
                                                                                                  it
                   The error component e  is decomposed as below;
                                          it


                   International Congress on High-speed Rail: Technologies and Long Term Impacts - Ciudad Real (Spain) - 25th anniversary Madrid-Sevilla corridor  317
   314   315   316   317   318   319   320   321   322   323   324