
Page 30 - 360.revista de Alta Velocidad - Nº 6
P. 30
Jaro, Lorenzo. Folgueira, César.
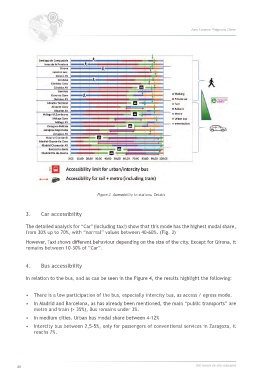
Figure 2. Accessibility to stations. Details
3. Car accessibility
The detailed analysis for “Car”(including taxi) show that this mode has the highest modal share,
from 30% up to 70%, with “normal” values between 40-60%. (Fig. 3)
However, Taxi shows different behaviour depending on the size of the city. Except for Girona, it
remains between 10-30% of “Car”.
4. Bus accessibility
In relation to the bus, and as can be seen in the Figure 4, the results highlight the following:
• There is a low participation of the bus, especially intercity bus, as access / egress mode.
• In Madrid and Barcelona, as has already been mentioned, the main “public transports” are
metro and train (> 35%), Bus remains under 3%.
• In medium cities, Urban bus modal share between 4-12%
• Intercity bus between 2,5-5%, only for passengers of conventional services in Zaragoza, it
reachs 7%.
28 360.revista de alta velocidad