Page 382 - 360.revista de Alta Velocidad - Nº 5
P. 382
Pagliara, Francesca. Menicocci, Fabrizio.Vassallo, José Manuel. Gómez Sánchez, Juan.


                   where:

                           β   is the intercept, i.e. the expected value of p when all the predictors are 0;
                            0
                           β  i  are the regression coefficients, estimated through the calibration process.


                   As  a  consequence  of  this  linearization  process,  the  interpretation  of  the  β   coefficients  is
                                                                                                 k
                   different compared to standard linear regression models. The slope coefficient suggests that
                   for a unit increase in a certain explanatory variable X , the weighted log of the odds in favor of
                                                                        k
                                                            βk
                   a certain alternative (Y=1) increases of e . Moreover, for a unit increase of a given explanatory
                                                                                        βk
                   variable X , the odds ratio in favor of happening Y=1 increases of e . Furthermore, unlike a
                             k
                   simple linear regression, logistic regression parameters are usually estimated with the method
                   of maximum likelihood, an iterative process calculating small corrections until the convergence
                   is reached.
                   Regarding the goodness of fit of the model, R  statistics refer to the entire model and indicates
                                                                2
                   how useful the explanatory variables are in predicting the response variable. The Cox & Snell
                   and the Nagelkerke R  are two of the most used statistics. The maximum value for Cox & Snell
                                         2
                     2
                                                           2
                   R  is less than 1 while the Nagelkerke R  provides a correction of this one and covers the full
                   range from 0 to 1 and therefore is often preferred.
                   A preliminary  analysis  has been  carried out to check  potential  collinearity  between  the
                   explanatory variables ECO-EXC and INCOME < 2000. Specifically a correlation analysis based on
                   the Chi2 test allows determining the level of relationship between both variables. With a level
                   of significance equal to 0.05 and 1 degree of freedom, according to the Chi  test the alternative
                                                                                             2
                   hypothesis is accepted and the variables are independent.  Estimation results for the binary
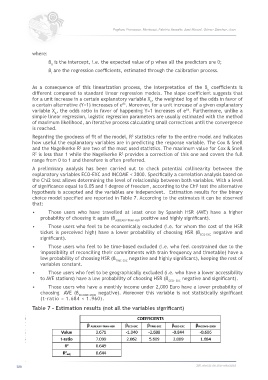
                   choice model specified are reported in Table 7. According to the estimates it can be observed
                   that:
                   •       Those users who have travelled  at  least  once by Spanish  HSR (AVE) have  a higher
                       probability of choosing it again (β          positive and highly significant).
                                                        ALREADY-TRAV-HSR
                   •       Those users who feel to be economically excluded (i.e. for whom the cost of the HSR
                       ticket is perceived high) have a lower probability of choosing HSR (β  ECO-EXC  negative and
                       significant).
                   •       Those users who feel to be time-based excluded (i.e. who feel constrained due to the
                       impossibility of reconciling their commitments with train frequency and timetable) have a
                       low probability of choosing HSR (β TIME-EXC  negative and highly significant), keeping the rest of
                       variables constant.
                   •       Those users who feel to be geographically excluded (i.e. who have a lower accessibility
                       to AVE stations) have a low probability of choosing HSR (β     negative and significant).
                                                                                GEO- EXC
                   •       Those users who have a monthly income under 2,000 Euro have a lower probability of
                       choosing   AVE  (β INCOME<2000   negative).  Moreover  this  variable  is  not  statistically  significant
                       (t–ratio = 1.684 < 1.960).

                   Table 7 - Estimation results (not all the variables significant)


            380                                                                             360.revista de alta velocidad

