Page 526 - 360.revista de Alta Velocidad - Nº 6
P. 526
Ortega, Alejandro. Almujibah, Hamad. Preston, John.


                 and Madrid – Valencia 14% (PWC, 2010). The remaining demand can be attributed to transport
                 mode shift. There are also important differences between  induced traffic expectations  and
                 reality that can be explained by higher prices and lower frequencies than forecasted as well
                 as economic downturn (Fernandez, 2012). In fact, as Fernandez pointed out official forecasts
                 were revised downwards before the new lines entered into service to take into account the
                 new services and prices. So, forecasting HSR demand accurately is difficult (Guirao and Campa,
                 2014) and therefore there are usually implicit risks associated with demand. Moreover, official
                 forecasts could also be deliberately biased upwards due to strategic misrepresentation from
                 the Government (van Wee and Flyvbjerg, 2010); they can justify potential demand in the future
                 to develop HSR.

                 By contrast, domestic transport in Saudi Arabia is composed of three main modes: road, air
                 and marine. Despite the recent increase in air transport demand, road transport has the lion’s
                 share of the transport in Saudi Arabia by far, with more than 95% of the national passenger-km.
                 This high percentage can be explained by the easy accessibility to private automobiles as well
                 as low fuel prices, which have increased automobile traffic levels in recent years resulting in
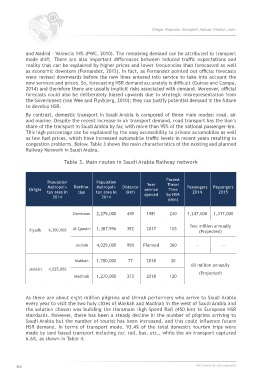
                 congestion problems. Below, Table 3 shows the main characteristics of the existing and planned
                 Railway Network in Saudi Arabia.

                                  Table 3. Main routes in Saudi Arabia Railway network


                                                                               Fastest
                          Population            Population            Year     Travel
                  Origin   Metropoli-  Destina-  Metropoli-  Distance   service   Time   Passengers   Passengers
                          tan area in   tion    tan area in   (km)   opened    by HSR      2014       2015
                            2014                  2014
                                                                                (min)


                                      Dammam    2,275,000    449      1981      240     1,247,000   1,317,000

                                                                                         Two million annually
                  Riyadh   6,300,000   Al-Qassim   1,387,996   352    2017      105           (Projected)


                                      Jeddah    4,025,000    950     Planned    360         --          --


                                      Makkah    1,780,000     77      2018       30
                                                                                          60 million annually
                  Jeddah   4,025,000
                                                                                              (Projected)
                                      Madinah   1,270,000    373      2018      120


                 As there are about eight million pilgrims and Umrah performers who arrive to Saudi Arabia
                 every year to visit the two holy cities of Makkah and Madinah in the west of Saudi Arabia and
                 the solution chosen was building the Haramain High Speed Rail (450 km) to European HSR
                 standards. However, there has been a steady decline in the number of pilgrims arriving to
                 Saudi Arabia but the number of tourist has been increased, and this could influence future
                 HSR demand. In terms of transport mode, 93.4% of the total domestic tourism trips were
                 made by land based transport including car, rail, bus, etc., while the air transport captured
                 6.6%, as shown in Table 4.


            524                                                                             360.revista de alta velocidad

