Page 472 - 360.revista de Alta Velocidad - Nº 6
P. 472
Martín Cabo, Sergio. Mesa Santos, Luis Eduardo. Palacio Vijande, Iván.


                 Once these steps are completed, a variety of outcomes is obtained, although it would be more
                 accurate to call them “products”, which will be explained in the following chapter.

                 4.    Outcomes


                       4.1     Presentation of the product in google earth


                 The first result obtained from these processes has already been mentioned: the creation of a
                 geo-referenced database, which serves as a starting point for later products.

                 A first product developed has been the transposition of the geo-referenced database with lines
                 and stations layers to the Google Earth platform. In other words, it means viewing the geometry
                 of high-speed  lines  and  their  stations  via  satellite.  So far,  it  has  been  made  for  European
                 countries. In the future, it is expected that Atlas-Rail project will be implemented in countries
                 of other continents that already have high-speed rail services.
                 For this, it has been necessary to transform the geospatial data, i. e. files with extension .shp
                 created in the GIS to files type .kml (Keyhole Markup Language). In this way the identification and
                 displaying of high-speed lines, sections, stations, connections between lines and neighbouring
                 countries networks are possible using this online platform.

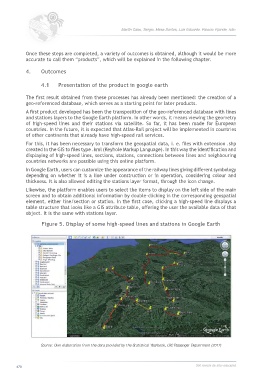
                 In Google Earth, users can customize the appearance of the railway lines giving different symbology
                 depending on whether it is a line under construction or in operation, considering colour and
                 thickness. It is also allowed editing the stations layer format, through the icon change.
                 Likewise, the platform enables users to select the items to display on the left side of the main
                 screen and to obtain additional information by double-clicking in the corresponding geospatial
                 element, either line/section or station. In the first case, clicking a high-speed line displays a
                 table structure that looks like a GIS attribute table, offering the user the available data of that
                 object. It is the same with stations layer.

                        Figure 5. Display of some high-speed lines and stations in Google Earth


                       Source: Own elaboration from the data provided by the Statistical Yearbook, UIC Passenger Department (2017)


            470                                                                             360.revista de alta velocidad

