
Page 42 - 360.revista de Alta Velocidad - Nº 6
P. 42
Delaplace, Marie.
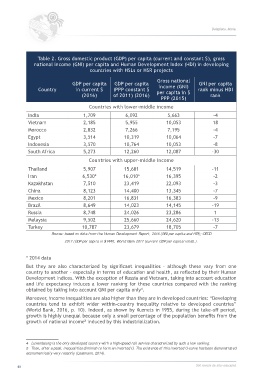
Table 2. Gross domestic product (GDP) per capita (current and constant $), gross
national income (GNI) per capita and Human Development Index (HDI) in developing
countries with HSLs or HSR projects
Gross national
GDP per capita GDP per capita GNI per capita
Country in current $ (PPP constant $ income (GNI) rank minus HDI
(2016) of 2011) (2016) per capita in $ rank
PPP (2015)
Countries with lower‐middle income
India 1,709 6,092 5,663 ‐4
Vietnam 2,185 5,955 10,053 18
Morocco 2,832 7,266 7,195 ‐4
Egypt 3,514 10,319 10,064 ‐7
Indonesia 3,570 10,764 10,053 ‐8
South Africa 5,273 12,260 12,087 ‐30
Countries with upper‐middle income
Thailand 5,907 15,681 14,519 ‐11
Iran 6,530* 16,010* 16,395 ‐2
Kazakhstan 7,510 23,419 22,093 ‐3
China 8,123 14,400 13,345 ‐7
Mexico 8,201 16,831 16,383 ‐9
Brazil 8,649 14,023 14,145 ‐19
Russia 8,748 24,026 23,286 1
Malaysia 9,502 25,660 24,620 ‐13
Turkey 10,787 23,679 18,705 ‐7
Source: based on data from the Human Development Report, 2016 (GNI per capita and HDI); OECD
2017 (GDP per capita in $ PPP); World Bank 2017 (current GDP per capita/inhab.).
* 2014 data
But they are also characterized by significant inequalities – although these vary from one
country to another – especially in terms of education and health, as reflected by their Human
Development Indices. With the exception of Russia and Vietnam, taking into account education
and life expectancy induces a lower ranking for these countries compared with the ranking
obtained by taking into account GNI per capita only .
4
Moreover, income inequalities are also higher than they are in developed countries: “Developing
countries tend to exhibit wider within‐country inequality relative to developed countries”
(World Bank, 2016, p. 10). Indeed, as shown by Kuznets in 1955, during the take‐off period,
growth is highly unequal because only a small percentage of the population benefits from the
growth of national income induced by this industrialization.
5
4 Luxembourg is the only developed country with a high‐speed rail service characterized by such a low ranking.
5 Then, after a peak, inequalities diminish to form an inverted U. The existence of this inverted U‐curve has been demonstrated
econometrically very recently (Lessmann, 2014).
40 360.revista de alta velocidad