Page 354 - 360.revista de Alta Velocidad - Nº 5
P. 354
Sepúlveda Abad, Silvia. Lastra de la Rubia, Emilia.


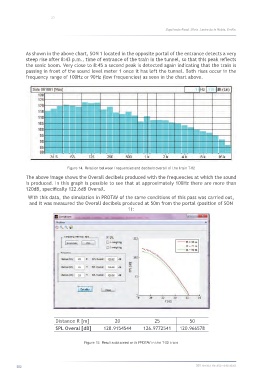
                 As shown in the above chart, SON 1 located in the opposite portal of the entrance detects a very
                 steep rise after 8:43 p.m., time of entrance of the train in the tunnel, so that this peak reflects
                 the sonic boom. Very close to 8:45 a second peak is detected again indicating that the train is
                 passing in front of the sound level meter 1 once it has left the tunnel. Both rises occur in the
                 frequency range of 100Hz or 90Hz (low frequencies) as seen in the chart above.


                                   Figure 14. Relation between frequencies and decibels overall of the train T-02

                 The above image shows the Overall decibels produced with the frequencies at which the sound
                 is produced. In this graph is possible to see that at approximately 100Hz there are more than
                 120dB, specifically 122.6dB Overall.
                 With this data, the simulation in PROTAV of the same conditions of this pass was carried out,
                  and it was measured the Overall decibels produced at 50m from the portal (position of SON
                                                              1):


                              Distance R [m]            20                25             50
                              SPL Overal [dB]      128.9154544       126.9772541     120.966578


                                          Figure 15. Results obtained with PROTAV in the T-02 train


            352                                                                             360.revista de alta velocidad

