Page 352 - 360.revista de Alta Velocidad - Nº 5
P. 352
Sepúlveda Abad, Silvia. Lastra de la Rubia, Emilia.


                 •  PROTAV performs an analysis of the generation and propagation of pressure waves inside
                    a tunnel with a higher degree of accuracy than other existing tools and also at a very low
                    computational cost.
                 •  In order to ensure greater accuracy of the studied phenomenon, PROTAV allows to define
                    a  multitude  of  parameters  identified  as  relevant  in  the  calculation  of  the  aerodynamic
                    phenomenon:  velocity,  length,  perimeter  and  train  area,  tightness,  tunnel  geometry,
                    existence of pressure dissipating elements ...
                 •  PROTAV is a tool with a relatively simple and intuitive operation.

                 In long tunnels with low friction (slab track), the nonlinear effects of wave propagation produce
                 a steepness of the pressure wave front and can form a shock wave. Increasing the pressure
                 gradient of the wavefront increases the wave's ability to radiate energy out of the tunnel by
                 impacting the output.

                 The method selected by IDR and proposed for the study of radiation is based on the wave
                 separation process proposed by Kikuchi in 2009. This method consists of placing two microphones
                 within the tunnel, whose relative position must be accurately known and placed at some distance
                 from the exit of the tunnel. Another microphone is placed outside the tunnel at such a distance
                 that the flat wave hypothesis can be assured to capture the radiated wave and calculate the
                 transfer function of the tunnel exit.

                       7.1     Protav validation

                 As can be seen in previous sections, four sections were instrumented, three inside the tunnel,
                 and the fourth on the outside with the sonometers.
                 Sections 1 have been considered as comparison sections located at ch 354 + 825 and section 3
                 located at ch 358 + 450 direction Valencia. The comparison pass is the T-02, an S-112 train that
                 is detected in the tunnel at 8:44 h at 291 km/h and is detected at the exit section at 8:45 h at
                 296 km/h. This train has been taken as a comparison train, since in this case the sonometers of
                 section 4 detected a sonic boom.

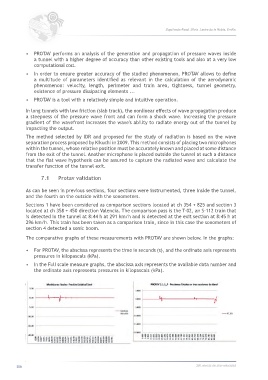
                 The comparative graphs of these measurements with PROTAV are shown below. In the graphs:

                 •  For PROTAV, the abscissa represents the time in seconds (s), and the ordinate axis represents
                    pressures in kilopascals (kPa).
                 •  In the Full scale measure graphs, the abscissa axis represents the available data number and
                    the ordinate axis represents pressures in kilopascals (kPa).


            350                                                                             360.revista de alta velocidad

