Page 353 - 360.revista de Alta Velocidad - Nº 5
P. 353
Influence of Aerodynamics in Tunnels Design


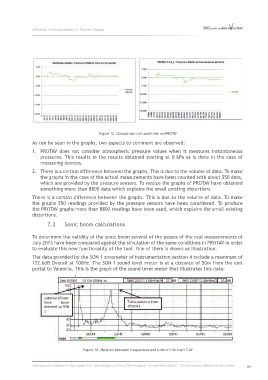
                                                 Figure 12. Comparison full-scale test vs PROTAV
                   As can be seen in the graphs, two aspects to comment are observed:

                   1.  PROTAV  does  not  consider  atmospheric  pressure  values  when  it  measures  instantaneous
                       pressures. This results in the results obtained starting at 0 kPa as is done in the case of
                       measuring devices.
                   2.  There is a certain difference between the graphs. This is due to the volume of data. To make
                       the graphs in the case of the actual measurements have been counted with about 550 data,
                       which are provided by the pressure sensors. To realize the graphs of PROTAV have obtained
                       something more than 8800 data which explains the small existing distortions.
                   There is a certain difference between the graphs. This is due to the volume of data. To make
                   the graphs 550 readings provided by the pressure sensors have been considered. To produce
                   the PROTAV graphs more than 8800 readings have been used, which explains the small existing
                   distortions.

                          7.2     Sonic boom calculations

                   To determine the validity of the sonic boom several of the passes of the real measurements of
                   July 2013 have been compared against the simulation of the same conditions in PROTAV in order
                   to evaluate this new functionality of the tool. One of them is shown as illustration.

                   The data provided by the SON 1 sonometer of instrumentation section 4 include a maximum of
                   122.6dB Overall at 100Hz. The SON 1 sound level meter is at a distance of 50m from the exit
                   portal to Valencia. This is the graph of the sound level meter that illustrates this data:


                                          Figure 13. Relation between frequencies and time of the train T-02


                   International Congress on High-speed Rail: Technologies and Long Term Impacts - Ciudad Real (Spain) - 25th anniversary Madrid-Sevilla corridor  351

