Page 425 - 360.revista de Alta Velocidad - Nº 6
P. 425
”LOS ANGELES-BOSTON: 20h on High Speed”


                   As a summary of the economic-financial analysis carried out for the LA-BO itinerary, some data
                   are highlighted in the following sections.


                          a) Operating revenue
                   The average occupancy of the itinerary, of 5,979 km, is 8.83 Mp / y, which means an average
                   operating revenue of 13,990 M $ / y.
                   At the age of ten it could be in service from Los Angeles (CA) to Reno / Carson (NV) (927 km with
                   demand of 18.6 Mp / y), on the other hand, from Denver (CO) to Columbus (OH) (via Chicago /
                   Gary) (2,241 km with 5.4 Mp/y) and on the other hand, from Washington DC To Boston (MA) (847
                   km with 14.9 Mp / y). That is, 3,715 km, with an average operating revenue of 11,125 M $ / y.


                          b) Rolling stock required for the operation
                   The following mobile material (for circulation and minimum reserve), both for service (TAV),
                   and for assistance and rescue (VAL), is foreseen:
                       •  Years 9 to 14: 50 TAV of 540 seats (348 seats and 192 beds / berths) and 26 VAL

                       •  Years 15 to 50: 80 TAV of 540 seats (348 seats and 192 beds / berths) and 84 VAL

                          c)      Operating costs

                   Annual operating costs are the sum of hourly costs (ch), linked to driving hours and kilometer
                   costs, multiplied by a factor (F) of annual hours of service.

                   The unit costs, updated to 2017, of the US Bureau of Labor Statistics, are: cu h = 37 $ / h and
                   cekm = 2.57 $ / km   F = 365 * (15 or 21). n = number of trains

                   Operating costs will therefore be:
                              ≈ 300 M$/y  (years 9 to 14)

                              ≈ 765 M&/y  (years15 to 50)


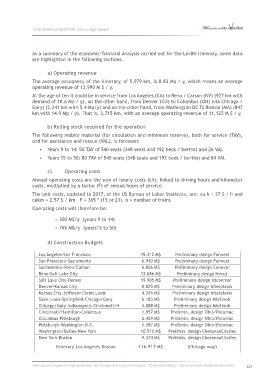
                          d) Construction Budgets

                      Los Angeles-San Francisco                     15.312 M$      Preliminary design Farwest
                      San Francisco-Sacramento                      6.910 M$       Preliminary design Farwest
                      Sacramento-Reno/Carson                        6.806 M$       Preliminary design Canevar
                      Reno-Salt Lake City                           13.686 M$       Preliminary design Nevut
                      Salt Lake City-Denver                         19.905 M$     Preliminary design Utconmar
                      Denver-Kansas City                            8.825 M$      Preliminary design Interplains
                      Kansas City-Jefferson/Saint Louis             4.345 M$      Preliminary design Interplains
                      Saint Louis-Springfield-Chicago/Gary          6.183 M$       Preliminary design Misilinoh
                      Chicago/Gary-Indianapolis-Cincinnati/H        5.088 M$       Preliminary design Misilinoh
                      Cincinnati/Hamilton-Columbus                  1.957 M$     Prelimin. design Ohio/Potomac
                      Columbus-Pittsburgh                           2.429 M$     Prelimin. design Ohio/Potomac
                      Pittsburgh-Washington D.C.                    5.587 M$     Prelimin. design Ohio/Potomac
                      Washington/Dulles-New York                    10.510 M$   Prelimin. design ChesananCharles
                      New York-Boston                               9.374 M$    Prelimin. design ChesananCharles

                              Itinerary Los Angeles-Boston         116.917 M$           (Chicago way)


                   International Congress on High-speed Rail: Technologies and Long Term Impacts - Ciudad Real (Spain) - 25th anniversary Madrid-Sevilla corridor  423

