
Page 236 - 360.revista de Alta Velocidad - Nº 6
P. 236
Kim, Junghwa. Li, Yeun-Touh. Schmöcker, Jan-Dirk.
determines the right number of components in the mixture model (Lee and Timmermans, 2007;
Kim et al. 2013). In this study, we are going to confirm which model has a high model fit and
then to select more appropriate models between the two based on BIC with consideration of
AIC. Those formulas are:
where LL is the value of the log-likelihood function at convergence and means the level of
model fit, K is the number of parameters in the model, and N is the total sample size (Wen
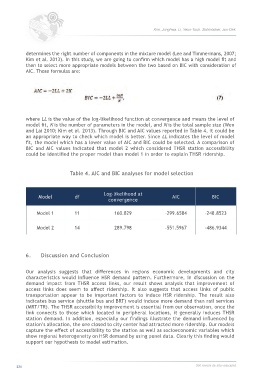
and Lai 2010; Kim et al. 2013). Through BIC and AIC values reported in Table 4, it could be
an appropriate way to check which model is better. Since LL indicates the level of model
fit, the model which has a lower value of AIC and BIC could be selected. A comparison of
BIC and AIC values indicated that model 2 which considered THSR station accessibility
could be identified the proper model than model 1 in order to explain THSR ridership.
Table 4. AIC and BIC analyses for model selection
Log-likelihood at
Model df AIC BIC
convergence
Model 1 11 160.829 -299.6584 -248.8523
Model 2 14 289.798 -551.5967 -486.9344
6. Discussion and Conclusion
Our analysis suggests that differences in regions economic developments and city
characteristics would influence HSR demand pattern. Furthermore, in discussion on the
demand impact from THSR access links, our result shows analysis that improvement of
access links does seem to affect ridership. It also suggests that access links of public
transportation appear to be important factors to induce HSR ridership. The result also
indicates bus service (shuttle bus and BRT) would induce more demand than rail services
(MRT/TR). The THSR accessibility improvement is essential from our observation, once the
link connects to those which located in peripheral locations, it generally induces THSR
station demand. In addition, especially our findings illustrate the demand influenced by
station’s allocation, the one closed to city center had attracted more ridership. Our models
capture the effect of accessibility to the station as well as socioeconomic variables which
show regional heterogeneity on HSR demand by using panel data. Clearly this finding would
support our hypothesis to model estimation.
234 360.revista de alta velocidad