
Page 235 - 360.revista de Alta Velocidad - Nº 6
P. 235
Impacts of station accessibility and regional heterogeneity on HSR ridership
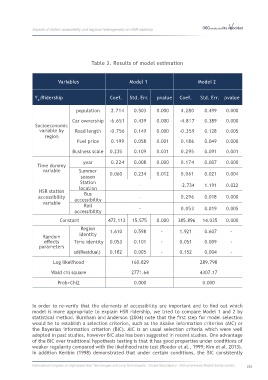
Table 3. Results of model estimation
Variables Model 1 Model 2
Y :Ridership Coef. Std. Err. pvalue Coef. Std. Err. pvalue
it
population 2.714 0.503 0.000 4.280 0.499 0.000
Car ownership -6.651 0.439 0.000 -4.817 0.389 0.000
Socioeconomic
variable by Road length -0.756 0.149 0.000 -0.359 0.128 0.005
region
Fuel price 0.199 0.058 0.001 0.186 0.049 0.000
Business scale 0.235 0.109 0.031 0.295 0.091 0.001
year 0.224 0.008 0.000 0.174 0.007 0.000
Time dummy
variable Summer 0.060 0.234 0.012 0.061 0.021 0.004
season
Station
location - -2.734 1.191 0.022
HSR station Bus
accessibility accessibility - 0.296 0.018 0.000
variable
Rail - 0.053 0.019 0.005
accessibility
Constant 472.113 15.575 0.000 385.896 14.035 0.000
Region 1.610 0.598 - 1.921 0.607 -
Random identity
effects Time identity 0.053 0.101 - 0.051 0.009 -
parameters
sd(Residual) 0.182 0.005 - 0.152 0.004 -
Log likelihood 160.829 289.798
Wald chi square 2771.64 4307.17
Prob>Chi2 0.000 0.000
In order to re-verify that the elements of accessibility are important and to find out which
model is more appropriate to explain HSR ridership, we tried to compare Model 1 and 2 by
statistical method. Burnham and Anderson (2004) note that the first step for model selection
would be to establish a selection criterion, such as the Akaike information criterion (AIC) or
the Bayesian information criterion (BIC). AIC is an usual selection criteria which were well
adopted in past studies, however BIC also has been suggested in recent studies. One advantage
of the BIC over traditional hypothesis testing is that it has good properties under conditions of
weaker regularity compared with the likelihood ratio test (Roeder et al., 1999; Kim et al. 2013).
In addition Keribin (1998) demonstrated that under certain conditions, the BIC consistently
International Congress on High-speed Rail: Technologies and Long Term Impacts - Ciudad Real (Spain) - 25th anniversary Madrid-Sevilla corridor 233