
Page 228 - 360.revista de Alta Velocidad - Nº 6
P. 228
Kim, Junghwa. Li, Yeun-Touh. Schmöcker, Jan-Dirk.
1. Introduction
Taiwan high-speed rail (THSR) opened its operation from 2007. The system primarily relies
on imported rolling stock from Japan and supplemented with European traffic management
system. Through connecting the island’s economic corridor north to south, serving almost 90%
of the industry and the population. It had progressively reformed Taiwan into a “One-day living
circle”. The nearly 350 kilometers investment has significantly reduced the travel time from
4 hours into 1.5 hours, which the interregional accessibility of the Western coast Taiwan has
naturally improved (Li et al. 2015).
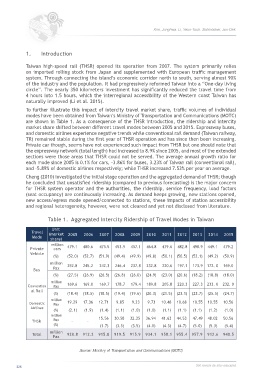
To further illustrate this impact of intercity travel market share, traffic volumes of individual
modes have been obtained from Taiwan’s Ministry of Transportation and Communications (MOTC)
are shown in Table 1. As a consequence of the THSR introduction, the ridership and intercity
market share shifted between different travel modes between 2005 and 2015. Expressway buses,
and domestic airlines experience negative trends while conventional rail demand (Taiwan railway,
TR) remained stable during the first year of THSR operation and has since then been increasing.
Private car though, seems have not experienced such impact from THSR but one should note that
the expressway network (total length) had increased to 8.9% since 2005, and most of the extended
sections were those areas that THSR could not be served. The average annual growth ratio for
each mode since 2005 is 0.1% for cars, -3.86% for buses, 3.23% of Taiwan rail (conventional rail),
and -5.89% of domestic airlines respectively; while THSR increased 7.53% per year on average.
Cheng (2010) investigated the initial stage operation and the aggregated demand of THSR; though
he concluded that unsatisfied ridership (compared to previous forecasting) is the major concern
for THSR system operator and the authorities, the ridership, service frequency, load factors
(seat occupancy) are continuously increasing. As demand keeps growing, new stations opened,
new access/egress mode opened/connected to stations, these impacts of station accessibility
and regional heterogeneity, however, were not cleared and yet not disclosed from literature.
Table 1. Aggregated Intercity Ridership of Travel Modes in Taiwan
Unit
Travel (market 2005 2006 2007 2008 2009 2010 2011 2012 2013 2014 2015
Mode share)
million
Private cars 479.1 480.6 475.5 453.9 457.1 464.8 479.6 482.8 498.9 449.1 479.2
Vehicle
(%) (52.0) (52.7) (51.9) (49.4) (49.9) (49.8) (50.1) (50.5) (52.1) (49.2) (50.9)
million 252.8 245.2 242.3 246.4 237.8 232.8 220.6 197.1 173.9 172. 0 169.0
Bus Pax
(%) (27.5) (26.9) (26.5) (26.8) (26.0) (24.9) (23.0) (20.6) (18.2) (18.8) (18.0)
million
Convention Pax 169.6 169.0 169.7 178.7 179.4 189.8 205.8 220.3 227.3 233. 0 232. 0
al Rail
(%) (18.4) (18.5) (18.5) (19.4) (19.6) (20.3) (21.5) (23.1) (23.7) (25.5) (24.7)
million
Domestic Pax 19.29 17.36 12.71 9.85 9.23 9.73 10.48 10.68 10.55 10.55 10.56
Airlines
(%) (2.1) (1.9) (1.4) (1.1) (1.0) (1.0) (1.1) (1.1) (1.1) (1.2) (1.0)
million 15.56 30.58 32.35 36.94 41.63 44.53 47.49 48.02 50.56
THSR Pax - -
(%) (1.7) (3.3) (3.5) (4.0) (4.3) (4.7) (5.0) (5.3) (5.4)
million
Total 920.8 912.2 915.8 919.5 915.9 934.1 958.1 955.4 957.9 912.6 940.5
Pax
Source: Ministry of Transportation and Communications (MOTC)
226 360.revista de alta velocidad