Page 545 - 360.revista de Alta Velocidad - Nº 6
P. 545
Methodology to determine the optimal design speed in a High-Speed Line


                   As it can be observed in Figure 6, cost per kilometre lies within a range between 8.6M€/
                   km and 15.8M€/km, depending on the maximum speed considered. In view of the results,
                   in can be asserted that the values obtained for the study case are in line with the real
                   cost of the MadridValencia high-speed line.

                   If the influence of the speed in the investment costs is analysed, the results clearly show
                   that  the  higher  the  speed  the  higher  the  costs. This  make  sense  because,  in  order  to
                   increase the commercial speed, it is necessary to increase the maximum design speed of
                   some or all of the sub-sections. As it was shown in the previous section, an increase in
                   maximum speed, whatever the type of terrain is, implies an increase in the investment
                   cost.

                   Other important issue to point out from the results is that each commercial speed has a
                   minimal investment cost, which results from a certain combination of maximum design
                   speed per subsection. If it is determined for each combination of maximum design speed
                   the minimal investment cost, as it been performed in Figure 6, it is obtained the curve of
                   minimal investment, which establish the boundary of the minimal investment.


                   5.     Study case: Effect of the speed on the financial and socio-economic profitability


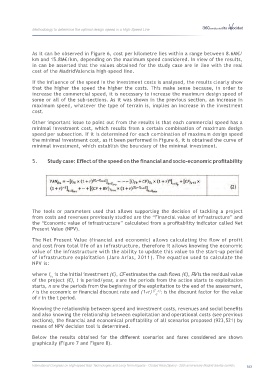
                   The  tools or parameters used that allows supporting the decision of tackling a project
                   from costs and revenues previously studied are the “Financial value of infrastructure” and
                   the “Economic value of infrastructure” calculated from a profitability indicator called Net
                   Present Value (NPV).

                   The Net Present Value (financial and economic) allows calculating the flow of profit
                   and cost from total life of an infrastructure, therefore it allows knowing the economic
                   value of the infrastructure with the ability to update this value to the start-up period
                   of infrastructure exploitation (Jaro Arias, 2011). The equation used to calculate the
                   NPV is:

                   where I  is the initial investment (€), CF estimates the cash flows (€), RV is the residual value
                           To
                   of the project (€), t is period/year, s are the periods from the action starts to exploitation
                   starts, n are the periods from the beginning of the exploitation to the end of the assessment,
                   r is the economic or financial discount rate and (1+r)  (T -t) : is the discount factor for the value
                                                                          0
                   of r in the t period.
                   Knowing the relationship between speed and investment costs, revenues and social benefits
                   and also knowing the relationship between exploitation and operational costs (see previous
                   sections), the financial and economical profitability of all scenarios proposed (923,521) by
                   means of NPV decision tool is determined.

                   Below  the  results  obtained  for  the  different  scenarios  and  fares  considered  are  shown
                   graphically (Figure 7 and Figure 8).


                   International Congress on High-speed Rail: Technologies and Long Term Impacts - Ciudad Real (Spain) - 25th anniversary Madrid-Sevilla corridor  543

